Garden with Insight v1.0 Help: How to change how a soil layer aspect is graphed
For soil patch aspects in the soil
layers the model contains an array (or list) of numbers (e.g., Water content in layers 1, 2, 3, etc.).
However, you can graph only one number for each aspect. For soil layer
aspects you can choose either to summarize all or some of the layer values, or you can
select only one layer to graph.
If you choose to summarize layer information, you must first choose which layers to
summarize. Usually you will want to consider all the soil layers. After you choose the layers, you must
choose how you want the values to be summarized. The graphed value can be calculated using any
of these methods:
Total: The sum of values for all selected layers.
Average weighted by layer thickness: A weighted average of values for the selected layers based
on the thickness of each layer.
Average weighted by layer mass: A weighted average of values for the selected layers based on
the mass of each layer. Both weighted-average options give a more true average of values which are based
on physical quantities such as water content or amount of a material.
Average (not weighted): A simple average of values for the selected layers. Use this for
properties that do not depend on weight or thickness, such as temperature.
Minimum: The minimum value among the selected layers.
Maximum: The maximum value among the selected layers.
When you graph a soil layer aspect, the Average weighted by layer thickness method is selected
by default, and all soil layer values are included by default. To change these options in the graph window,
find the List column in the list box under the graph. (The List column is the last
column of the header, so if you cannot see it, drag the other columns
over to the left until it appears.) Click on the aspect's line in the list box in the List column. The
soil layer options window will appear.

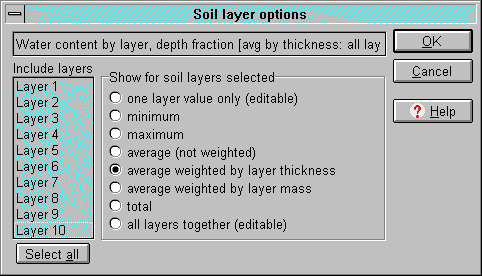
The soil layer options window
In the soil layer options window, choose one of the summary or selection methods. In the list of layers
on the left side of the window, select any layers you want to include in the summary. Select multiple layers
by holding down the Control key and clicking on multiple layers, or by clicking the Select
all button under the list. If you choose One layer value only and select more than one layer
in the layers list, the topmost layer you chose will be graphed.
Click OK to save your changes or Cancel to abandon them. When you return to the
graph window, the graph will update to reflect your changes. Note that the graph history will not
clear out when you change the way a graphed aspect is calculated, so the earlier values may not make
sense in relation to the new summary method.
| 
