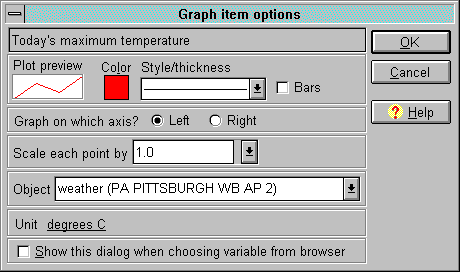
Garden with Insight v1.0 Help: Graph item options window
Use the graph item options window to change how a graphed aspect is displayed and how it gets its data.

The graph item options window
The elements in the graph item options window which can be edited are as follows.
Plot options: The plot preview shows a representative line with the plot options you have chosen.
Click on the Color square to choose a new color for the series. Click on the
Style/thickness box to choose another line width or style from the list (the list is only active if
bars are not chosen). Check the Bars check box to show bars, or uncheck it to show a line graph.
Axis: Choose from the left or right axis to graph the series. You can also change the axis by
clicking on the Axis column in the aspects list in the graph
window.
Scale: Change the scale from 1.0 when you want to compare aspects which may have different
ranges, like temperature (0-100 degrees F) and rainfall (0-10 inches). Choose a value from the scale list or
type in your own value.
Object: You can only change the object to which an aspect belongs if the object is a soil patch or
plant. For example, you can change a graphed aspect so that instead of graphing the soil temperature of
patch A, it graphs the soil temperature of patch B. Click on the object box and choose another object to
which to attach the aspect.
Unit: The unit to show the aspect in. Click to change to the next unit in the unit set of available units for the aspect.
To move backwards in the unit set, shift-click. You can also change the unit by clicking in the
Unit column of the aspects list in the graph window.
Show this dialog: You can choose not to show the graph item options window when you choose
a new graphed aspect if you always want to use the default options. Uncheck this check box to stop the
window from appearing. You can open the window at any time after the aspect is graphed by clicking on
the Line, Scale, Object, or List columns of the aspects list in the
graph window.
Click OK to save your changes or Cancel to abandon them. If you click
Cancel when first graphing an aspect from the browser, you will cancel any changes you made
in this window, but will not cancel graphing the aspect.
See also:
How to show a graphed aspect on its own axis
How to change a graph line to show bars or lines
How to change the color of a graph line
How to graph two aspects that have different ranges
How to make a graphed aspect work with a different soil patch or plant
| 
