Garden with Insight
Product area
Help System
Contents
Quick start
Tutorial
How-to
Models
|
Garden with Insight v1.0 Help: S curve
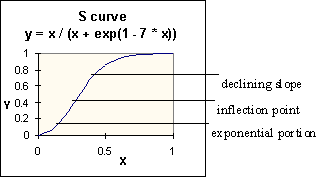
A typical S curve has an exponential portion in which the slope increases, an inflection point where the slope begins to decrease, and
a rounding-off portion where the slope is decreasing. The reason these are called S curves is that they look
roughly like an S laid on its side.

S-shaped curves are seen often in nature because they represent a fairly good abstraction of the course of a
self-limiting process such as the growth of an organism or population in a limited environment. If two
rabbits were placed on an island with no predators but a limited food supply, the number of rabbits would
increase exponentially for a time (as long as there was plenty of food), then slow down and finally round
off at the carrying capacity of the island -- the number of rabbits the island could accommodate.
This simulation uses S-shaped curves extensively for many processes, including chemical equlibria, plant
uptake of nutrients, plant leaf area
index (LAI), fruit growth, and soil temperature. Most of the S
curves used in this simulation have the form y = x / (x + exp(c1 - c2 * x)) where c1 and c2 are parameters that set the shape of the curve. Depending on these parameters,
an S curve can look like the one above, or be reversed, or have an almost imperceptible curve to it. Some
other equations use modified versions of this S curve equation.
|

