Garden with Insight v1.0 Help: Graph titles and scales window
Use the graph titles and scales window to change the graph window's
main title, axis titles, and axis scales.

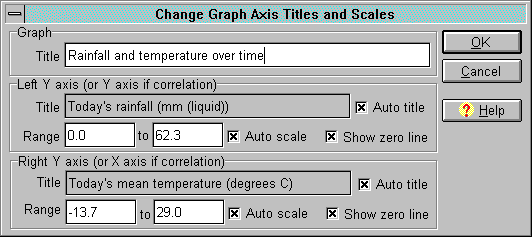
The graph titles and scales window
The graph titles and scales window is divided into three panels.
In the graph panel, you can edit the main graph title. Type a new title in the edit box after the
word Title.
In the left axis panel, you can edit the title and scale of the left axis. The left axis is the Y axis of
the graph in either time series mode or xy
mode. The left axis will only appear if you have at least one graphed aspect on the left axis.
In the right axis panel, you can edit the title and scale of the right axis. In time series mode, the
right axis is a second Y axis. In xy mode, the right axis becomes the X axis. The right axis will only
appear if you have at least one graphed aspect on the right axis.
Axis title
For each axis, either choose to auto-generate a title (from the name of the first graphed aspect on the
axis) or type in your own title. To auto-generate the title, check the Auto title check box. To
enter your own title, uncheck the Auto title check box, then type a title in the edit box after the
word Title.
Axis scale
For each axis, either choose to auto-generate the scale, or type in your own scale. To auto-generate
the scale, check the Auto scale check box. To enter your own scale, type in the edit boxes after
the word Scale (the Auto scale check box will uncheck itself automatically).
Axis zero line
If the scale for either axis crosses the zero line (e.g., -5.0 to 10.0), you can choose whether to mark a
line where the zero point lies. To show the zero line for either axis, check its Zero line check
box; to hide the zero line, uncheck it.
Click OK to save your changes or Cancel to abandon them.
See also:
How to label the graph axes
How to change the scales of the graph axes
How to graph two aspects that have different ranges
| 
